To cut or not to cut is no longer the question. Now the question is the quantity, magnitude and timing of rate cuts for the rest of the year.
This week was an important one in that we were privy to several important Fed speeches as well as some informative data about the state of the economy. The takeaway in aggregate was muddled. On one hand we had both Chairman Powell as well as St. Louis Fed President Bullard hinting that the Fed would start with a 25bps point cut in July. This came as a bit of a disappointment because Powell last week during his press conference indicated a 50bps cut in July could be in the cards. Bullard did say that another cut later in the year (read October or December) could be warranted, but this was somewhat of a disappointment for markets since Bullard is one of the most dovish of Fed policy makers.
On the other hand, data has continued to come in on the weak side including durable goods orders and initial unemployment claims that both missed expectations. Data misses like we have seen this week would warrant a far more aggressive rate cutting campaign than what is being signaled by the Fed currently.
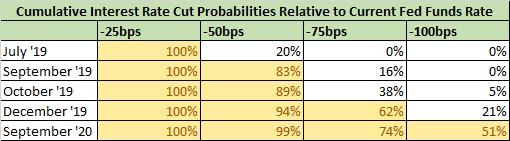
Where there is less ambiguity is what the market is expecting – and the market appears to be much more in line with the incoming economic data and the future trajectory of that data than the Fed, as we will show. Currently, the market places a 100% probability on a cut of at least 25bps points in July and a 20% probability of a 50bps cut. Those odds are in line with the Fed speeches this week. Moving ahead, the market places an 83% probability that the Fed Funds rate will be 50bps lower than today by September – well ahead of Fed signaling. By December the market assigns a 62% probability that the the Fed Funds rate will 75bps lower than today and by next year the market is pricing greater than a 50% probability than the Fed Funds rate will be 1% lower than it is today. Therefore, the market is placing higher odds on 75bps of cuts in 2019 than 50bps of cuts, and at the same time the market is expecting another 25bps of cuts in 2020.
So what path of policy is the more likely outcome, the Fed’s or the market’s?
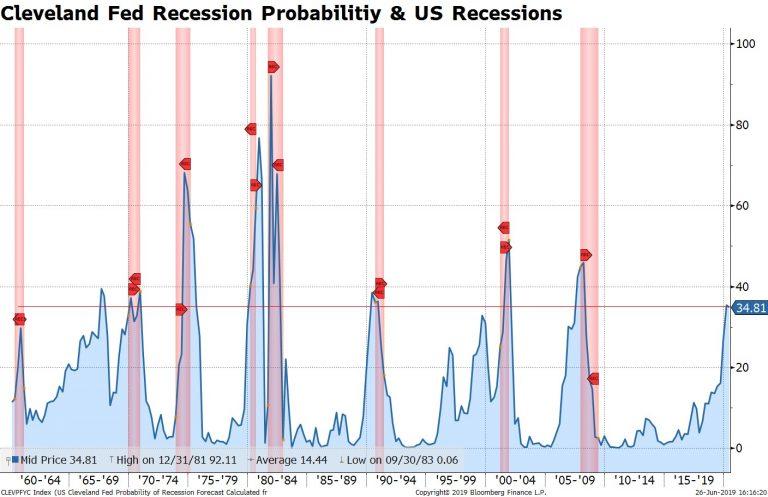
Let’s start with recession probabilities as published by the New York and Cleveland Fed offices. Based on the shape of the 10Y-3M yield curve, the New York Fed’s recession model predicts a 29.6% of a recession within the next 12 months. A probability of 29.6% by this model is relatively high and readings this high have preceded recessions every time but once (in 1967). The Cleveland Fed’s model incorporates the yield curve as well as GDP growth and is pointing to an elevated 34.8% of a recession in the coming 12 months. Here again, only once (in 1967) did the model predict a higher probability of a recession and a recession did not come. These models were correct in predicting 8 of the last 9 recessions for an 88% batting average. Of further importance is that the smaller spikes in recession probability in 1996 and 1999 that did not result in immediate recessions occurred after the Fed had provided some “insurance” rate cuts. The recession probability is higher today than it was in either of those two instances and the Fed has not yet started the rate cutting cycle. This indicates that the Fed needs to act sooner rather than later and probably to a degree that is larger in magnitude than their base case calls for.
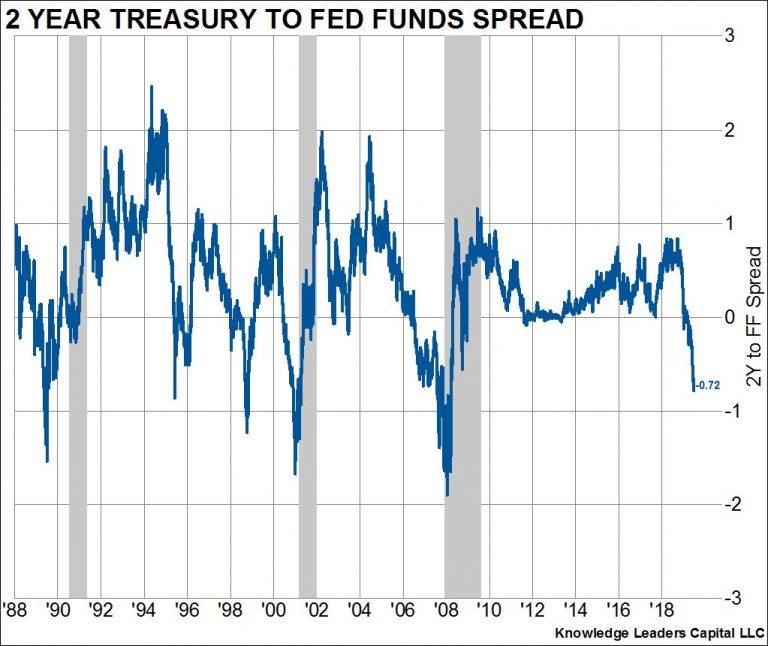
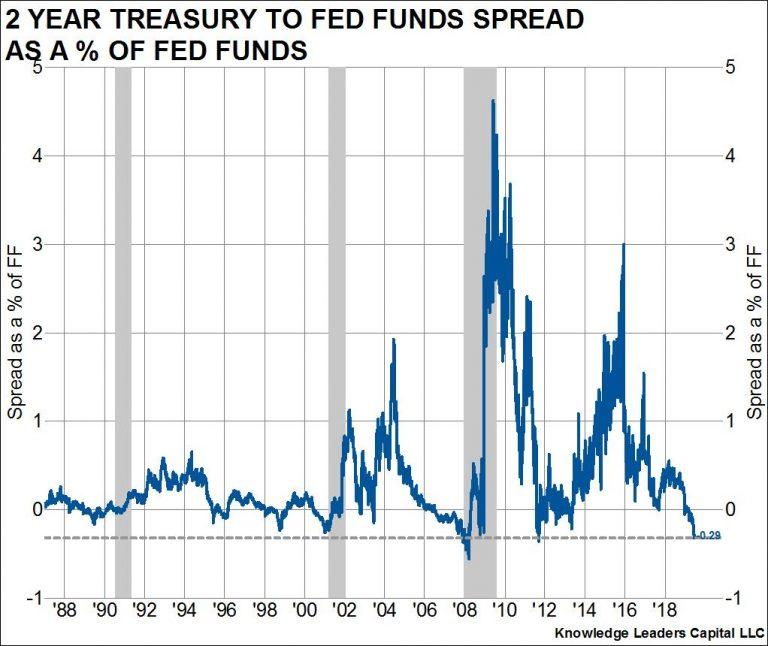
Let’s move on to the yield curve itself. Here we will examine the 2Y to Fed Funds yield spread, which currently stands an -72bps. Yes, this spread has been inverted to this degree several times without an impending recession (in both 1995 and 1998). Inversions did precede recessions in 1991, 2000 and 2008. However, the rate regime is different today than it has been at any time since the 2-year bond has existed in that the Fed Funds rate now is less than half of what it was at each of the last 5 inversions. In other words, an inversion of this magnitude when the Fed Funds rate is already so close to zero is information onto itself. Indeed, when we calculate the 2Y to Fed Funds spread as a percent of the Fed Funds rate – thereby normalizing the spread for the level of the Fed Funds rate – we observe that only once (in 2008) was this portion of the curve more inverted. By this measure the Fed is substantially behind the curve and should act by cutting rates by at least 25bps in July and September as a start.
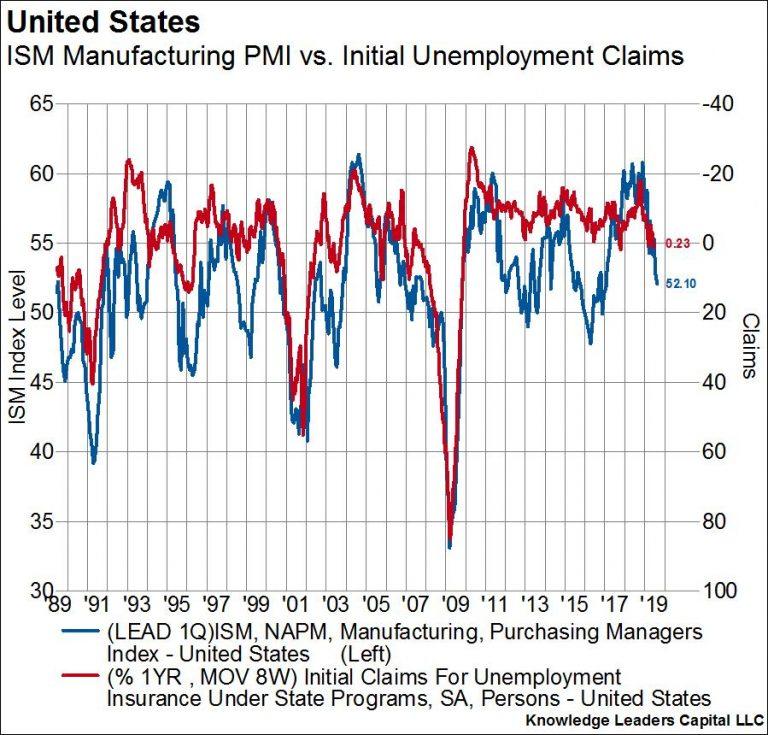
Unfortunately, it’s not just the yield curve that is signaling the need for rate cuts. Economic data are coming in weak across the board and are set to come in weak for at least another 6-12 months. Below we show how the manufacturing ISM PMI leads other indicators of economic activity by 1-2 quarters, and that that means continued weakness ahead.
The ISM PMI leads unemployment claims by 1 quarter. Claims have just recently started to rise on a normalized basis compared to year-ago levels, a trend that is set to continue through the summer at least.
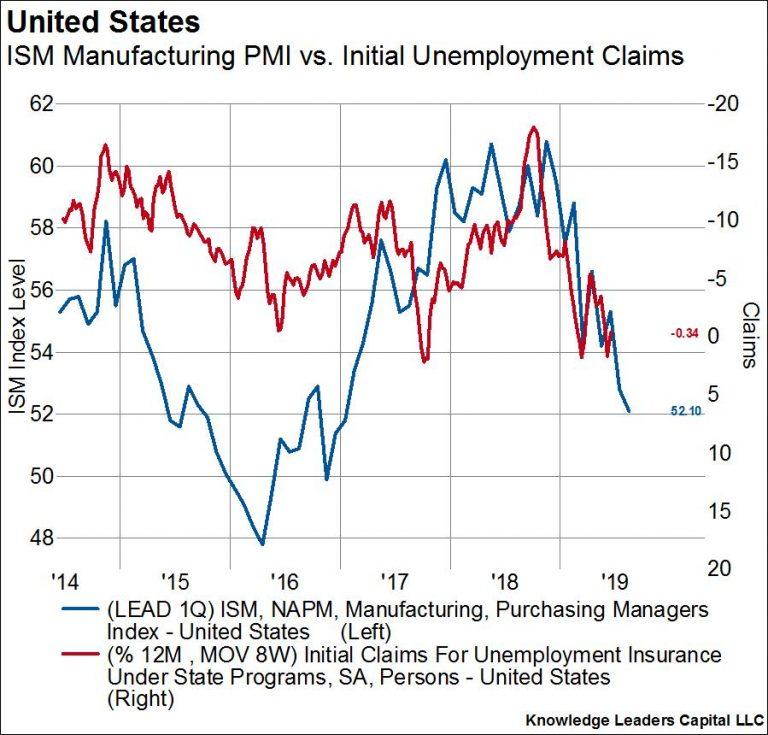
Here’s a closeup of that same series.
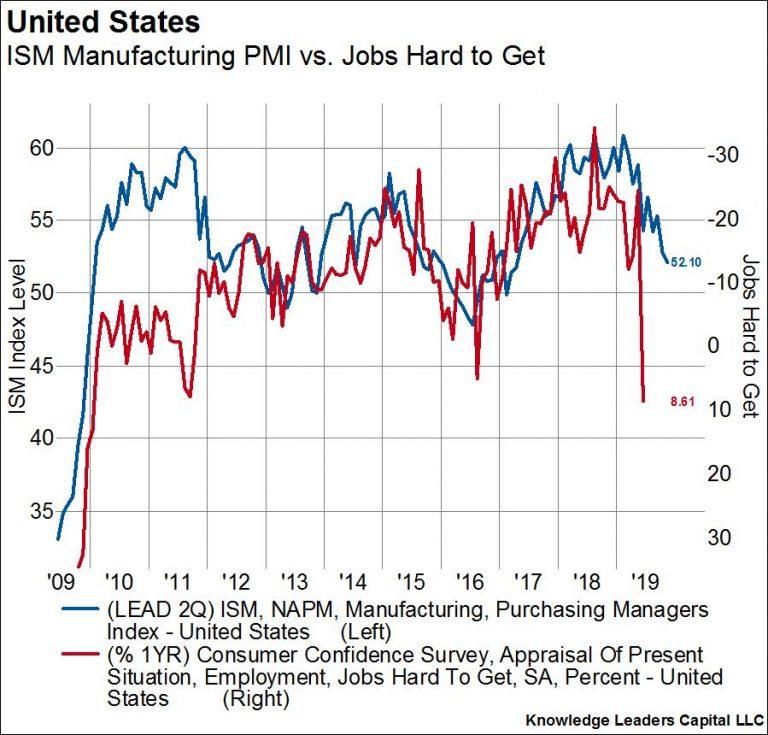
Staying with employment, the ISM PMI leads the Conference Board’s measure of hiring activity by 2 quarters. Currently, the “Jobs Hard to Get” component is standing at a level not seen since 2010. The ISM PMI predicts another 6 months of jobs being even harder to get than they are now.
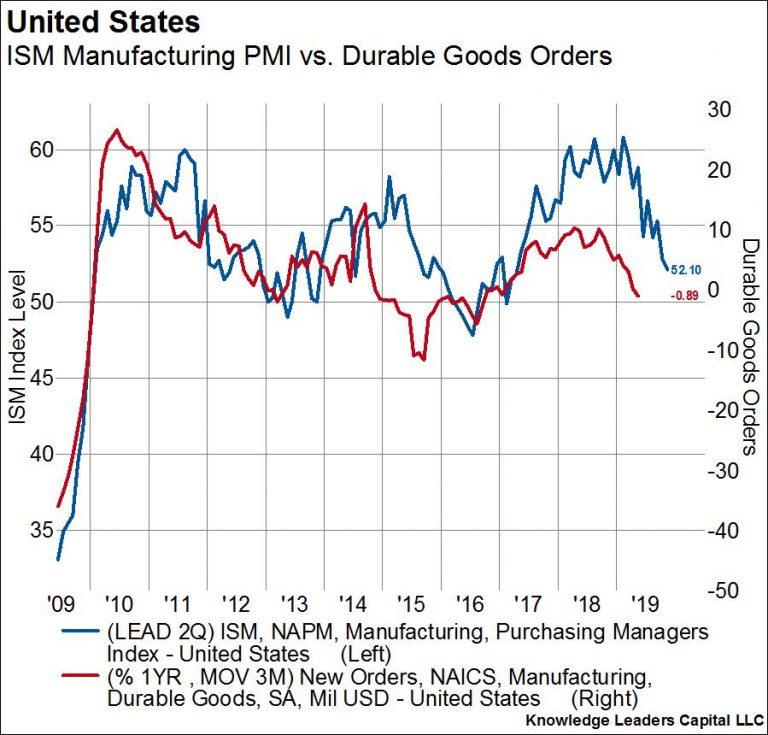
The ISM PMI leads durable goods orders by 2 quarters. This week’s disappointing durable goods orders seem not to be an aberration, but part of a trend that will continue for some time longer.
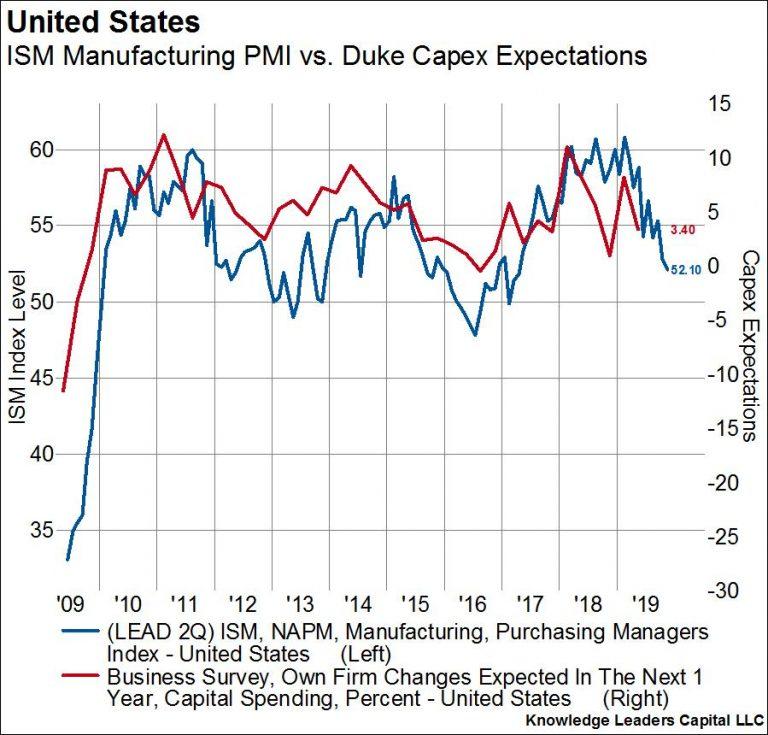
The ISM PMI leads capital expenditure expectations by 2 quarters. Duke University’s survey-based measure of capital formation tends to be one of the timelier indicators of capex investment. It has started to tick down since early 2018 and is set for at least another 6 months of weakness.
And yet, the ISM manufacturing PMI itself looks set to continue to fall through the entire second half of 2019. Here we overlay changes in the 10-year bond yield on top of the ISM PMI. Economic activity responds to changes in interest rates with about a 2-year lag. As such, we are still digesting the large rise in rates that occurred from 2016-2018.
If the ISM manufacturing PMI continues to decline through year end and leads the above economic variables by 1-2 quarters, then indicators of economic activity will be slowing down until this time next year. If this is the case then the Fed is indeed very far behind the curve.


No comments:
Post a Comment